For both new and established pet food manufacturers, investing in a dry pet food production line is one of the most critical and high-impact decisions. The wrong choice can result in cost overruns, excessive operational expenses, inconsistent product quality, and slower ROI, while the right one can secure a competitive market advantage for years. Many businesses underestimate the complexity of this investment — it’s not just about the purchase price of machines; it’s about total ownership cost, efficiency, compliance, scalability, and adaptability to market trends. This guide will give you a complete investment decision blueprint, with all the facts, calculations, and practical advice you need.
A dry pet food production line can cost anywhere between USD 50,000 and USD 2,000,000 depending on capacity, automation, configuration, and compliance requirements. The most cost-effective choice depends on matching production capacity to market demand, choosing the right level of automation, and planning for future scalability.
If you want to make the smartest long-term decision, you need more than a catalog — you need a deep understanding of market factors, technical design, operational economics, and supplier credibility. This buying guide will walk you through everything step-by-step.
The initial purchase price of a pet food production line is the biggest factor in determining ROI.خطأ
While initial cost is important, factors like production efficiency, energy consumption, labor costs, and downtime prevention have a greater long-term impact on ROI.
1. Understanding the Dry Pet Food Production Line
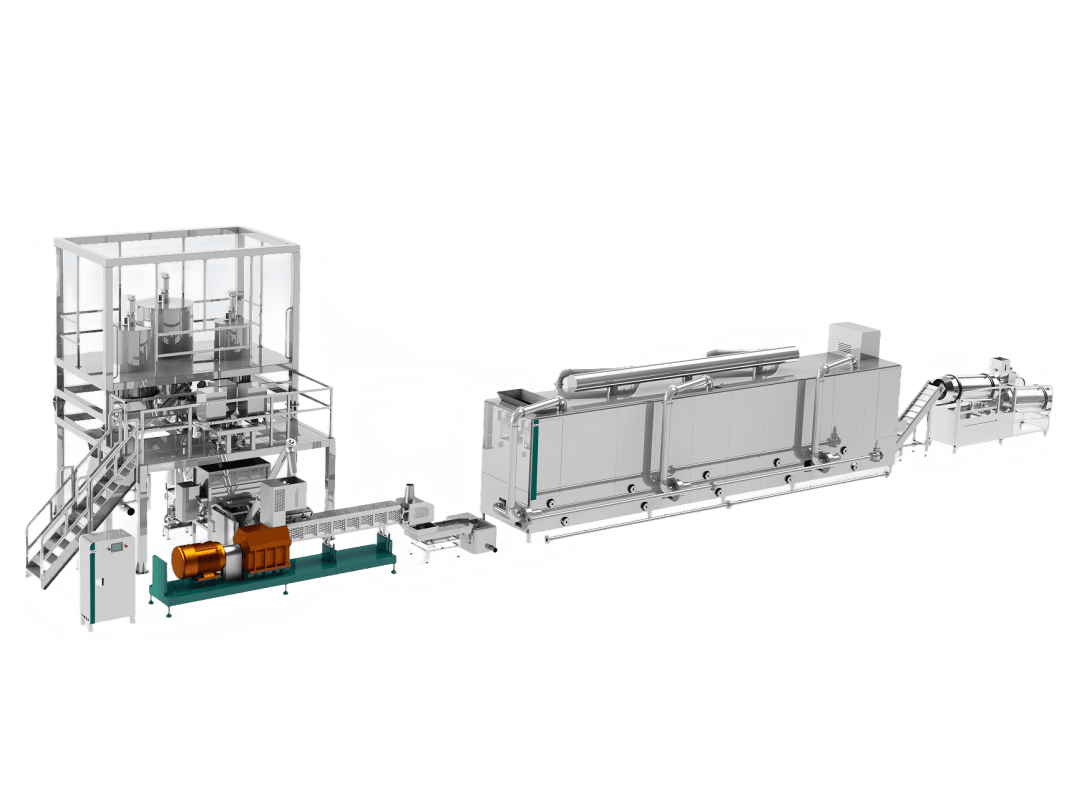
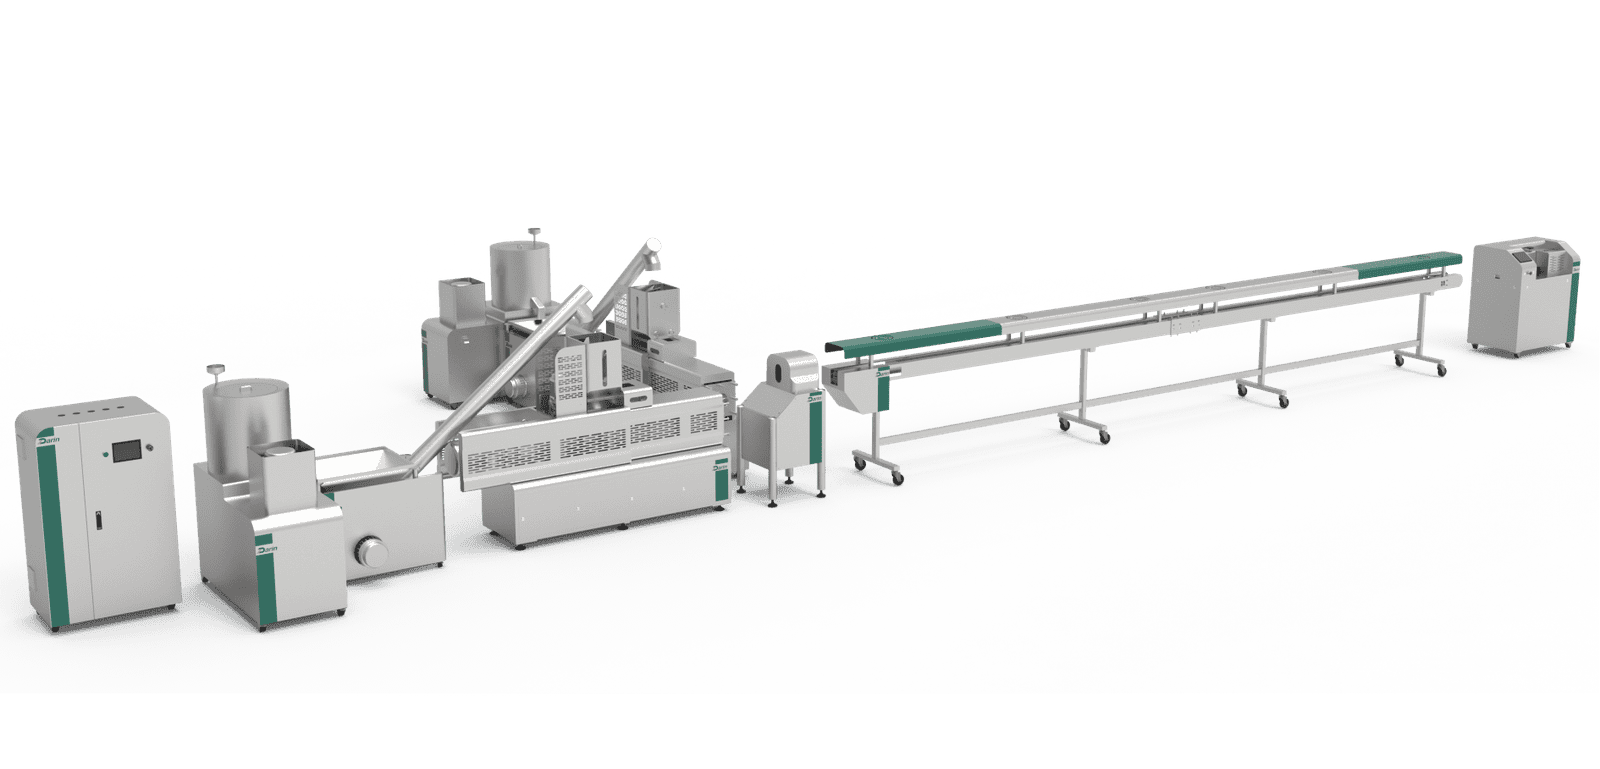
A خط إنتاج أغذية الحيوانات الأليفة الجافة is a complete integrated system for producing kibbles and pellets for dogs, cats, and other pets. It typically includes:
- Raw material handling (receiving, grinding, mixing)
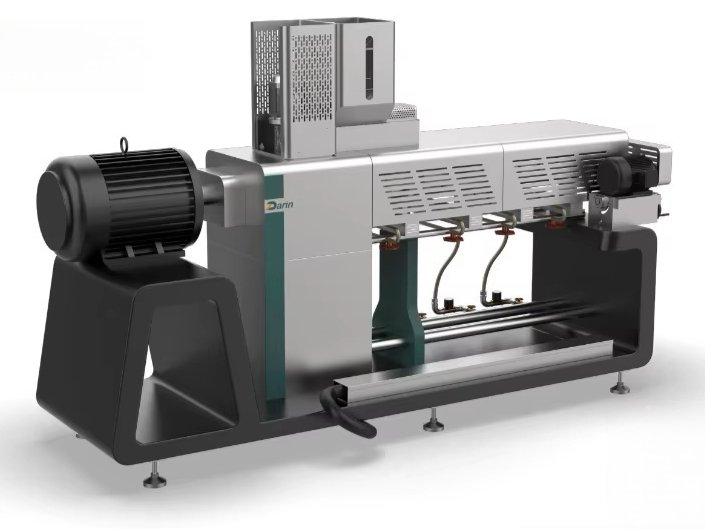
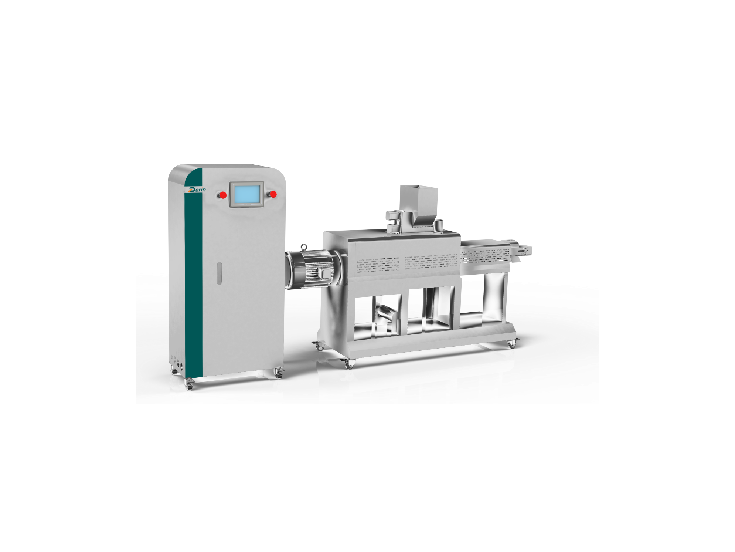
- Extrusion cooking (single or twin-screw)
- التجفيف والتبريد
- Coating and flavoring
- التعبئة والتغليف
We’ll break down each section with technical details, cost ranges, and operational implications.
2. Global Market Context
According to recent market data, the global pet food industry is projected to grow from USD 123 billion in 2023 to USD 160 billion by 2028, with dry pet food representing over 65% of total volume.
| المنطقة | 2024 Dry Pet Food Market Share (%) | Key Demand Drivers |
|---|---|---|
| أمريكا الشمالية | 38% | Premiumization, grain-free diets |
| أوروبا | 30% | Strict safety standards, sustainable sourcing |
| آسيا والمحيط الهادئ | 22% | Rapid pet ownership growth, urbanization |
| أمريكا اللاتينية | 6% | Rising middle class |
| الشرق الأوسط وأفريقيا | 4% | Emerging markets, premium imports |
3. Cost Breakdown: Capital Expenditure (CAPEX)
| فئة التكلفة | Low-End USD | High-End USD | Influencing Factors |
|---|---|---|---|
| Extruder (Single/Twin Screw) | 25,000 | 700,000 | Capacity, design, automation |
| مجفف ومبرد | 15,000 | 300,000 | Fuel type, energy efficiency |
| نظام الطلاء | 8,000 | 120,000 | Type (drum, vacuum) |
| Packaging Line | 10,000 | 250,000 | Manual vs. auto |
| مناولة المواد الخام | 5,000 | 150,000 | Bulk storage, conveyors |
| التحكم والأتمتة | 5,000 | 300,000 | PLC/SCADA |
| التثبيت والتدريب | 5,000 | 50,000 | Complexity, location |
| Facility Adaptation | 5,000 | 100,000 | Floor, utilities |
| TOTAL CAPEX | 50,000 | 2,000,000 | - |
4. Operational Costs (OPEX)
| مكون التكلفة | Monthly Range (USD) | الملاحظات |
|---|---|---|
| العمالة | 2,000–20,000 | Depends on automation |
| Energy (Electricity/Gas) | 1,500–25,000 | Dryers are energy-intensive |
| الصيانة | 500–5,000 | Preventive maintenance reduces downtime |
| المواد الخام | 5,000–120,000 | Major cost driver |
| Packaging Materials | 1,000–15,000 | Bags, sealing, labeling |
| مراقبة الجودة | 300–3,000 | Lab equipment, staff |
5. Capacity-Cost Curves
Below is a simplified capacity vs. CAPEX chart. In reality, the curve flattens at higher capacities due to economies of scale:
CAPEX (USD)
|
|                *
|              *
|            *
|         *
|     *
|  *
|_*___________________________________ Capacity (Tons/hour)
0.2 1 2 3 5 8 10- 0.2–1 t/h: Entry level, higher cost per ton capacity
- 2–5 t/h: Sweet spot for regional manufacturers
- 8–10 t/h: Best for large industrial plants
6. ROI Analysis
Example: Medium-Scale 3 t/h Plant
- CAPEX: \$500,000
- OPEX/month: \$45,000
- Selling price: \$1.50/kg
- Production: 22 days/month × 8 hours/day × 3 t/h = 528 t/month
- Revenue: 528,000 kg × \$1.50 = \$792,000/month
- Gross profit margin: 20% → \$158,400/month
- Payback period: \~3.15 months
7. Supplier Selection Checklist
| معايير | ما أهمية ذلك |
|---|---|
| Industry Reputation | Proven reliability |
| الامتثال | CE, ISO, FDA, AAFCO, local standards |
| التخصيص | Ability to tailor capacity/formula |
| دعم ما بعد البيع | Spare parts, remote assistance |
| كفاءة الطاقة | Reduces long-term OPEX |
| قابلية التوسع | Future-proof investment |
8. Case Studies
- Small Startup (China): 500 kg/h semi-auto line, \$85,000 investment, profitable in 12 months.
- Mid-Sized Regional Brand (Poland): 2 t/h fully auto line, \$380,000 investment, ROI in 7 months.
- Large Export-Oriented Factory (Brazil): 8 t/h mega-line, \$1.6M investment, ROI in 5 months.
9. Key Mistakes to Avoid
- Overcapacity purchase without proven sales channels.
- Ignoring دعم ما بعد البيع costs.
- Underestimating energy requirements.
- فقير facility layout planning causing inefficiency.
- Choosing low-quality equipment to save CAPEX but losing in OPEX.
A خط إنتاج أغذية الحيوانات الأليفة الجافة is not a one-size-fits-all purchase — the smartest investment is one that matches current market demand while allowing scalable growth. By combining capacity planning, automation analysis, ROI modeling, and supplier evaluation, you can turn this major capital expense into a high-return asset.
📞 Contact Darin Machinery لـ customized investment proposal with capacity-cost curves and ROI simulations for your market.